
Drawing
When boxes, text and icons aren't enough, draw: ui.canvas gives a draw function a ui.Painter, which fills and strokes paths with colors and gradients, through transforms and clips. ui.svg draws SVG documents the same way. Charts are drawn on canvases too (Charts); for per-pixel effects, see Shaders.
The gallery's Drawing page has the examples below (examples/gallery/drawing.zig, zig build run-gallery).
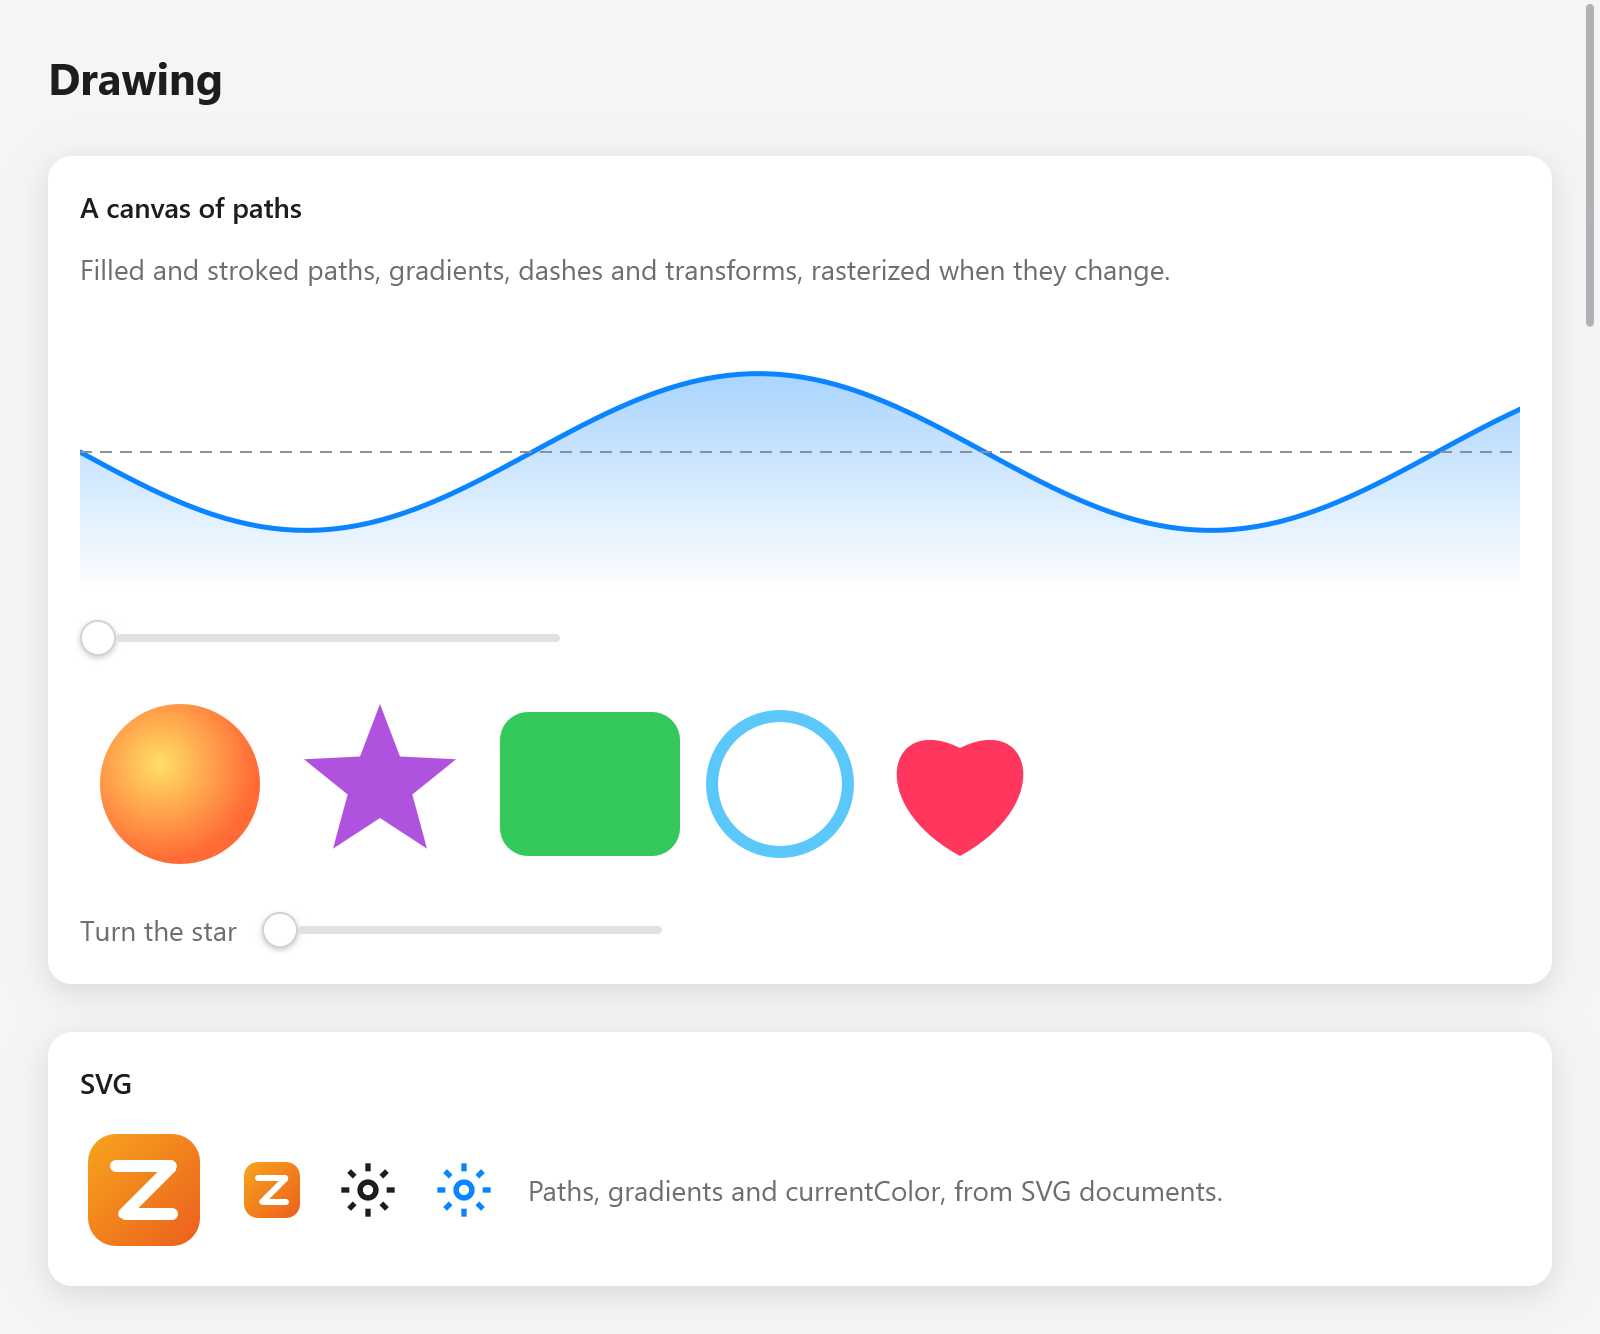
Canvas paths, gradients, dashed strokes, shapes and SVG images.
A canvas
const Wave = struct {
    phase: f32 = 0,

    fn draw(s: *Wave, p: *ui.Painter) void {
        var line = p.path();
        for (0..101) |i| {
            const x = p.size.w * @as(f32, @floatFromInt(i)) / 100;
            const y = p.size.h / 2 + 30 * @sin(@as(f32, @floatFromInt(i)) / 8 + s.phase);
            if (i == 0) line.moveTo(x, y) else line.lineTo(x, y);
        }
        p.stroke(&line, .color(.hex(0x0a84ff)), .{ .width = 2, .join = .round });
    }

    fn view(s: *Wave, c: *ui.Context) void {
        _ = ui.canvas(c, .{ .w = 300, .h = 120 }, .{ .radius = 8 }, s, draw);
        _ = ui.slider(c, &s.phase, .{ .min = 0, .max = 6.28, .label = "Phase" });
    }
};
ui.canvas(c, size, options, ctx, draw) makes a box size points large and calls draw(ctx, painter) to record what it shows. A side of 0 fills the parent along it: the canvas is drawn at the size it had in the last layout, which p.size tells. ui.CanvasOptions has key (an id that survives reordering), opacity and radius, which rounds the picture's corners and clips what is drawn there.
p.visible() is the part of the canvas in view, in the coordinates it draws in: its box within the scrolling boxes and clips around it and the window, as the last frame painted it, taken back through the transforms of its boxes and the painter's own, so a canvas zoomed in sees as much less of itself as shows. A drawing taller than the window (a long document, a chart's many points) skips what falls outside it; a frame that scrolled it draws once more with the part as it now is. Until a frame painted it, it is the whole canvas. Outside the painter, ui.canvasVisibility(c, id, whole) answers the same for the canvas that will take box id id (c.peekId), so an animation can pause while its canvas is scrolled out of view (the loading plugin does).
const v = p.visible();
for (s.lines, 0..) |l, i| {
    const y = @as(f32, @floatFromInt(i)) * 20;
    if (y + 20 < v.y or y > v.y + v.h) continue;
    p.fillRect(.{ .x = 4, .y = y, .w = l.width, .h = 14 }, th.text);
}
The canvas returns its box's index, so it can take the pointer like any box:
const box = ui.canvas(c, .{ .w = 0, .h = 200 }, .{}, s, draw);
const it = c.interact(box, .{});
if (it.clicked) if (it.rect) |r| s.addPoint(c.input.mouse.x - r.x, c.input.mouse.y - r.y);
How it is drawn
The Painter records commands; it draws nothing itself. The recording is rasterized on the CPU (src/ui/canvas_render.zig), with antialiasing, at the window's scale, into a picture in the image atlas, which every renderer then draws as it draws ui.image. A canvas is rasterized again only when what it records changes: the picture is keyed by a hash of the recording, so a frame that draws the same thing costs only the recording and the hash. A canvas that changes every frame (an animation) is rasterized every frame, so keep those small, or move the animated part to a box's transform (Transforms).
Paths, gradient stops and dashes given to the Painter are copied: pass any memory, even the stack.
Paths
p.path() makes a ui.Path in the frame's memory. Coordinates are points from the canvas's top left, y going down.
| method | draws |
|---|---|
moveTo(x, y) | starts a new subpath |
lineTo(x, y) | a straight segment |
quadTo(cx, cy, x, y) | a quadratic Bézier |
cubicTo(c1x, c1y, c2x, c2y, x, y) | a cubic Bézier |
close() | closes the subpath |
arc(cx, cy, r, a0, a1, ccw) | an arc of a circle, angles in radians |
svgArc(rx, ry, rotation, large, sweep, x, y) | SVG's elliptical arc to a point |
rect(x, y, w, h) | a rectangle |
roundRect(x, y, w, h, rx, ry) | a rounded rectangle |
ellipse(cx, cy, rx, ry), circle(cx, cy, r) | ellipses |
polyline(points, closed) | [2]f32 points joined |
append(data, transform) | another path's ui.PathData, transformed |
A path made with its own allocator (ui.Path.init(gpa)) can be kept across frames and reused: reset() empties it, deinit() frees it, and data() gives its ui.PathData (verbs and points) for p.fillData.
Filling and stroking
p.fill(&path, .color(.hex(0xaf52de)));
p.fillRule(&path, .color(c.theme.text), .evenodd); // holes where subpaths overlap
p.stroke(&path, .color(accent), .{ .width = 2.5, .join = .round, .cap = .round });
ui.FillRule is .nonzero (the default of fill) or .evenodd. A ui.Stroke:
| field | default | meaning |
|---|---|---|
width | 1 | in points |
join | .miter | ui.LineJoin: .miter, .round, .bevel |
cap | .butt | ui.LineCap: .butt, .round, .square |
miter_limit | 4 | longest a miter may be, in widths, before it is beveled |
dash | none | lengths on and off, repeated (an odd count is taken twice) |
dash_offset | 0 | where the dashes start |
Shorthands: fillRect(rect, color), fillRoundRect(rect, radius, paint), fillCircle(cx, cy, r, paint), strokeCircle(cx, cy, r, width, color) and line(x0, y0, x1, y1, width, color).
Paints and gradients
A ui.Paint is .color(c) (.solid), .linear or .radial, as SVG's gradients and Canvas 2D's:
p.fill(&area, .{ .linear = .{
    .from = .{ 0, 0 }, .to = .{ 0, h },
    .stops = &.{ .{ .offset = 0, .color = accent.alpha(0.45) }, .{ .offset = 1, .color = accent.alpha(0) } },
} });
p.fillCircle(50, 50, 40, .{ .radial = .{
    .center = .{ 40, 40 }, .radius = 48,
    .stops = &.{ .{ .offset = 0, .color = .hex(0xffe066) }, .{ .offset = 1, .color = .hex(0xff6b35) } },
} });
ui.LinearGradient goes from one point to another; ui.RadialGradient goes out from focal (the center unless given) to the circle of radius around center. Both take stops (ui.GradientStop: offset 0 to 1 and color), spread (.pad, .reflect or .repeat: what happens past the ends) and a transform from the gradient's space to the drawing's (SVG's gradientTransform).
Transforms, clips and layers
The Painter keeps a current transform, clip and opacity:
p.save();
p.rotate(s.turn * std.math.pi / 180, 150, 50); // radians, about (150, 50)
p.fill(&star, .color(.hex(0xaf52de)));
p.restore();save()andrestore()keep and bring back the transform, clip and opacity.transform(t)draws what follows through aui.Transform(after the transforms already set);translate(x, y),scaleBy(sx, sy)androtate(radians, cx, cy)are shorthands.ui.Transformhastranslation,scaling,rotation(radians),skewX,skewY,then,applyandinvert. (Boxes are transformed withui.Affine, in degrees; canvases withui.Transform, in radians, as Canvas 2D is.)clip(path, rule)andclipRect(rect)keep what follows inside, within the clips already set.setAlpha(a)fades what follows, untilrestore.beginLayer(opacity)andendLayer()draw a group apart, then blend it withopacity: a translucent group whose overlaps don't show.
SVG
const logo = @embedFile("logo.svg");

_ = ui.svg(c, logo, .{ .height = 32 });
_ = ui.svg(c, gear, .{ .width = 16, .color = c.theme.accent }); // its currentColor
ui.svg(c, bytes, options) draws an SVG document as a canvas does, at the window's scale, and returns false (drawing nothing) if the bytes aren't one. ui.SvgOptions:
| field | meaning |
|---|---|
width, height | its size in points; a side of 0 keeps the document's proportions, both 0 its own size |
color | what currentColor is; null is the theme's text color, so icons follow light and dark |
opacity | its opacity |
key | an id among its siblings |
The picture is kept: a frame showing the same bytes at the same size and color draws it without parsing them again.
What of SVG is drawn (src/ui/svg_draw.zig): the root's viewBox fitted with preserveAspectRatio, groups and nested svgs, paths and the basic shapes, use of elements and symbols, transforms, fills and strokes in colors and gradients (linear and radial, by reference, in either unit system), their opacities, group opacity, and clip paths. Colors may be hex, rgb(), hsl(), names or currentColor, and styles may come from attributes, style, or simple CSS rules in <style> (selectors by element, class and id). Text, masks, filters, markers and patterns are left out: convert text to paths when you export the file.
ui.rasterizeSvg(gpa, bytes, w, h, current_color) draws a document into premultiplied BGRA pixels, w × h, without a window: for icons made ahead of time, and tests. Free the result with gpa.
Images
Pictures from files (PNG, and on macOS whatever ImageIO reads) are not drawn on a canvas but shown with ui.image; see Text and Buttons and media.
Testing drawings
A canvas draws in the Tester as in a window, through the same rasterizer, so a test can render the view and look at pixels:
var t: ui.Tester = undefined;
try t.init(gpa, .init(&s, Wave.view), .{ .width = 320, .height = 160, .scale = 1 });
defer t.deinit();
const px = try t.render(gpa);
defer px.deinit(gpa);
See Testing.