
Charts
ui.chart draws line, area, bar, scatter and pie charts, with their axes, grid lines, legends, and a tooltip of the point nearest the pointer. They are drawn on a canvas (Drawing) and follow the theme. Its parts (scales, paths of lines, areas and slices, stacks, the nearest point) are public too, for charts of your own.
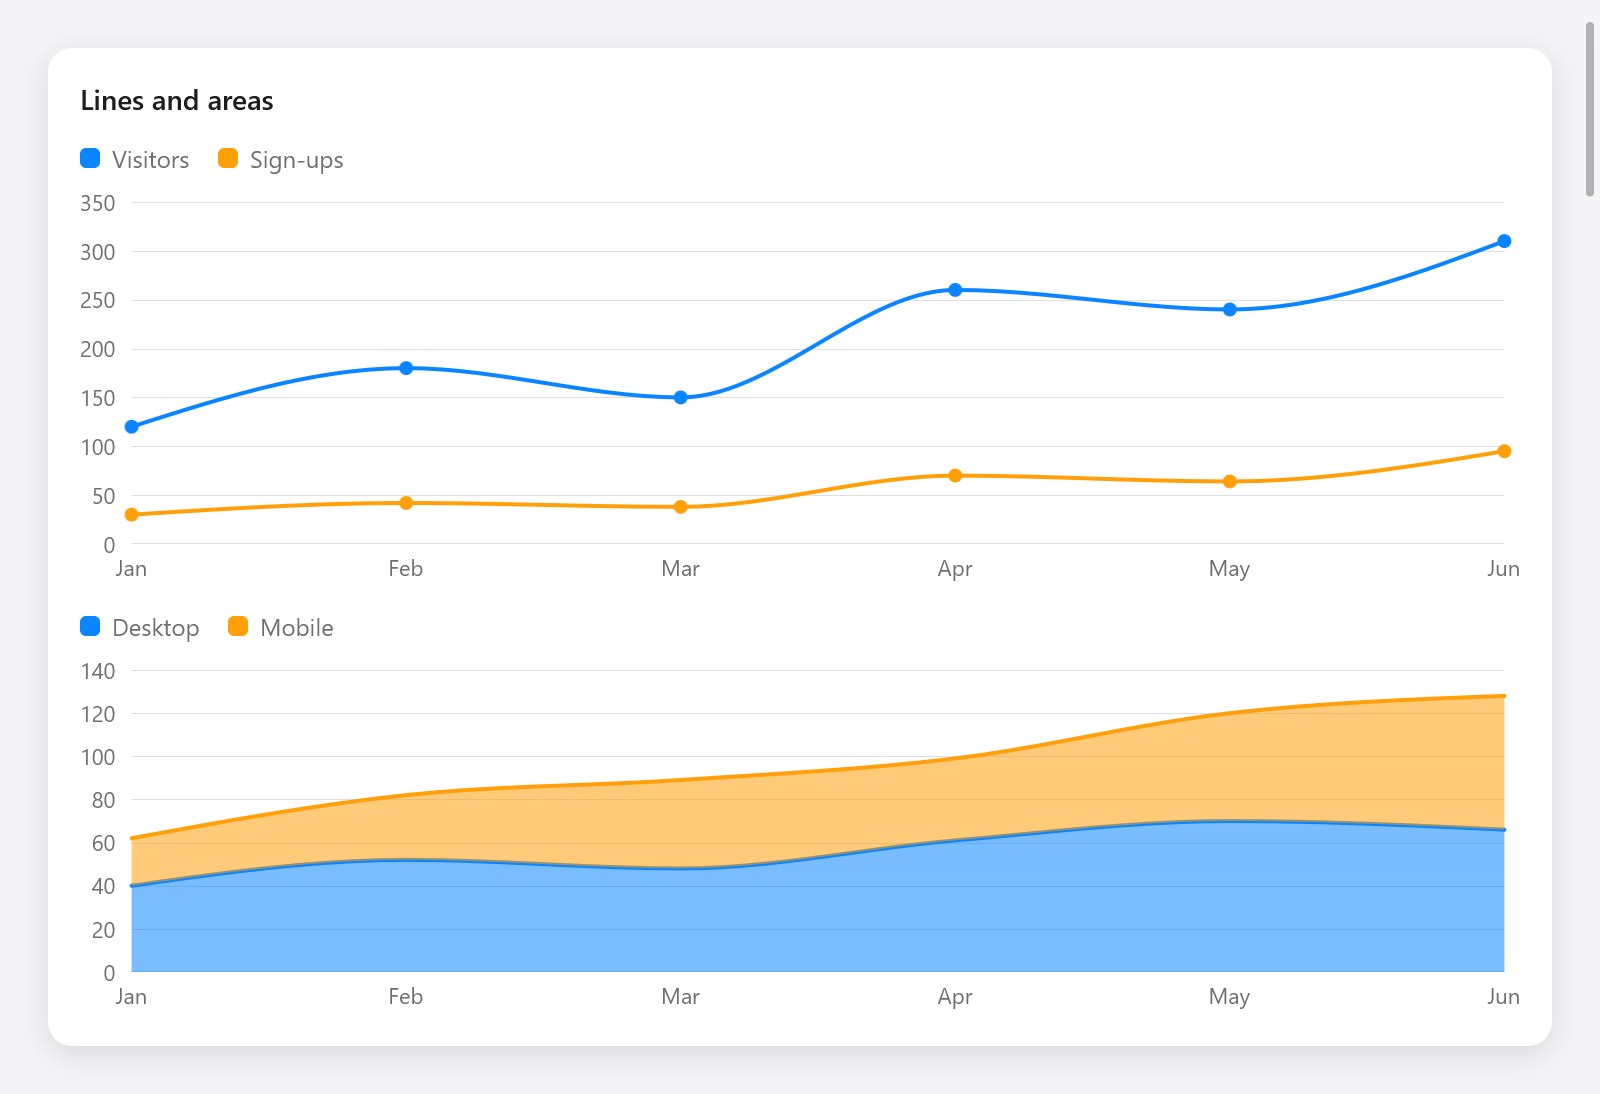
Line and stacked-area charts with labels and legends.
const chart = ui.chart;
const months = [_][]const u8{ "Jan", "Feb", "Mar", "Apr", "May", "Jun" };

const r = chart.lineChart(c, &.{
    .{ .name = "Visitors", .values = &.{ 120, 180, 150, 260, 240, 310 } },
    .{ .name = "Sign-ups", .values = &.{ 30, 42, 38, 70, 64, 95 } },
}, .{ .labels = &months, .curve = .monotone, .points = true, .height = 200 });
if (r.hover) |h| ui.text(c, months[h.index], .{ .size = 12 });
The gallery's Charts page shows every kind (examples/gallery/drawing.zig), and zig build run-chart-streaming three waveforms of 15 000 samples each, 1 000 new ones a second, drawn with the parts below.
Lines, areas and bars
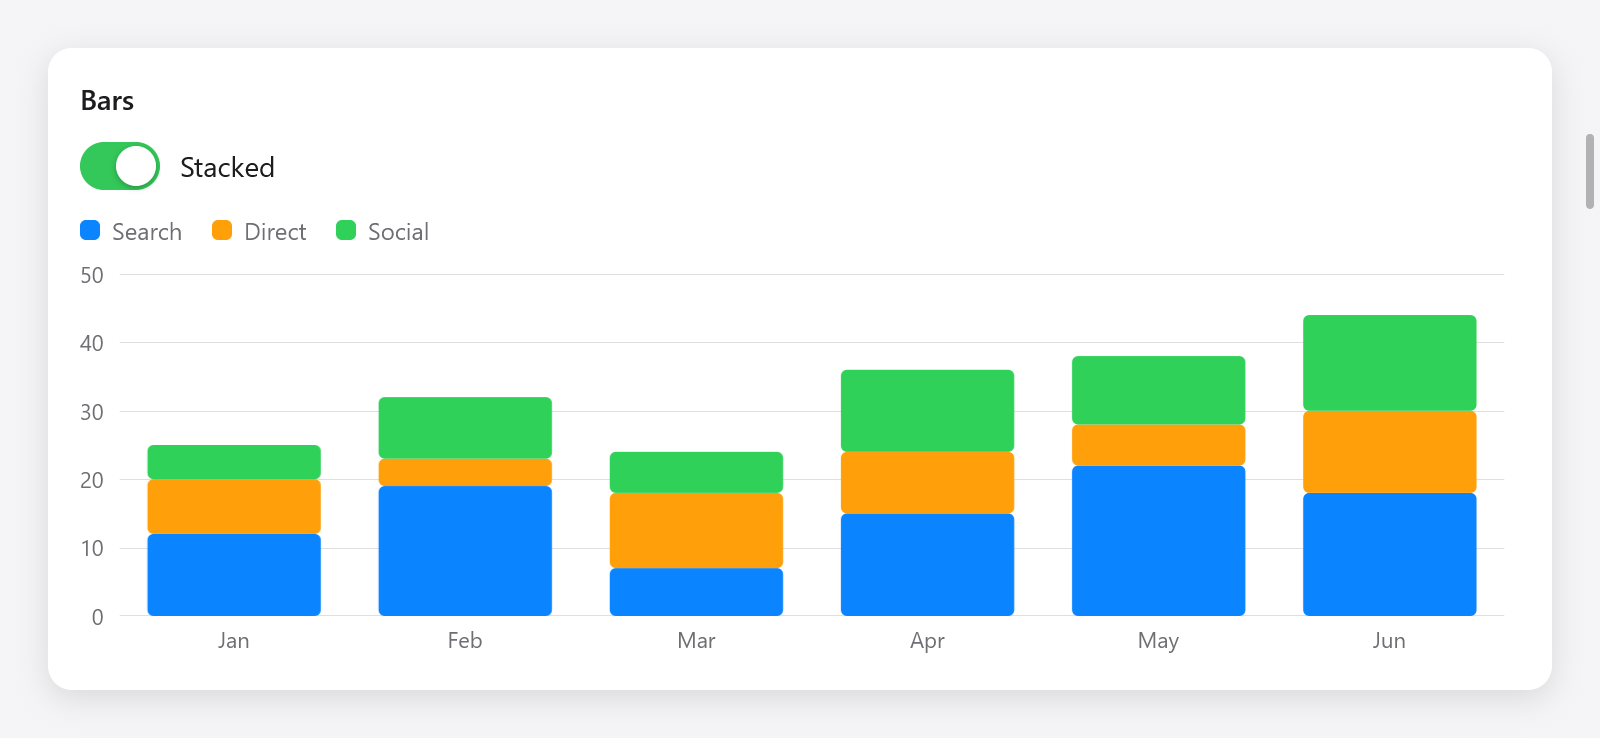
A stacked bar chart showing three traffic sources.
chart.lineChart, chart.areaChart and chart.barChart take chart.Series (a name, values, one for each point along x, NaN for none there, and an optional color, else the palette's by its place) and chart.Options:
| field | default | meaning |
|---|---|---|
width | 0 | in points; 0 fills the parent |
height | 220 | in points |
labels | none | labels along x, one for each point or bar |
ticks | 5 | about how many ticks the value axis has |
min, max | null | the value axis's ends; null: the data's, rounded out to ticks |
grid | true | grid lines at the ticks |
legend | true | the series' names and colors |
curve | .linear | how lines join points (below) |
stacked | false | areas and bars piled up, not side by side |
line_width | 2 | of lines |
points | false | dots at the points of lines |
decimals | null | of values in the tooltip; null up to two |
key | null | an id among its siblings |
_ = chart.areaChart(c, &.{
    .{ .name = "Desktop", .values = &.{ 40, 52, 48, 61, 70, 66 } },
    .{ .name = "Mobile", .values = &.{ 22, 30, 41, 38, 50, 62 } },
}, .{ .labels = &months, .stacked = true, .curve = .monotone, .height = 180 });

_ = chart.barChart(c, &.{
    .{ .name = "Search", .values = &.{ 12, 19, 7, 15, 22, 18 } },
    .{ .name = "Direct", .values = &.{ 8, 4, 11, 9, 6, 12 } },
}, .{ .labels = &months, .stacked = s.stacked, .height = 200 });chart.Curve, as d3's curves: .linear, .monotone (smooth, never past the values of the points it joins: d3's curveMonotoneX), .step, .step_after and .step_before.
Every chart returns a chart.Result: hover, the point the pointer is nearest (series and index), or null; and index, the chart's box, for c.interact (a click on a point) and tests.
Scatter
_ = chart.scatterChart(c, &.{.{ .name = "Samples", .xs = &xs, .ys = &ys }}, .{ .height = 200 });A chart.PointSeries has name, xs, ys and color. chart.ScatterOptions has width, height, ticks, radius (of the dots, 4), grid, legend, decimals, reach (how far, in points, the pointer may be from a point to pick it, 24) and key.
Pie and donut
_ = chart.pieChart(c, &.{
    .{ .label = "Zig", .value = 46 },
    .{ .label = "Go", .value = 28 },
    .{ .label = "Other", .value = 26 },
}, .{ .size = 180, .inner = 0.55 });
A chart.PieSlice has label, value and color. chart.PieOptions: size (its side, 200 points), inner (the hole of a donut as a fraction of the radius; 0 a pie), pad (radians between slices), legend, decimals and key. The slice under the pointer grows and tells its value and share.
Colors and legends
chart.palette holds the eight colors series take by default. A legend of your own: chart.legend(c, names, colors).
Charts of your own
The parts of the charts work on any canvas. Positions on a plot are fractions of it, from 0 to 1: along x from its left edge, along y from its bottom up, the way values grow. chart.x(rect, f) and chart.y(rect, f) turn them into points of a rectangle.
Scales
chart.Linear.init(lo, hi)maps values to fractions:at(v), back withinvert(f),span(a, b)between two values;nice(count)rounds the domain out to round ticks, andticks(gpa, count)giveschart.Ticks (at,value,label). Setclampto keep values outside it at its ends.chart.Band.init(count)gives a band to each ofcountlabels, as d3'sscaleBand:padding(inner, outer),band(i)(achart.Span,loandhi),width(),at(i),index(f)(which band a fraction is in), andticks(gpa, labels).chart.extent(values)is the smallest and largest of values (NaNs left out), andchart.format(gpa, value, decimals)writes a value as the axes do.
Shapes
chart.line(path, rect, xs, ys, curve)adds the line through points (in fractions) to aui.Path;chart.area(path, rect, xs, lo, hi, curve)the area between two lines (lonull for the bottom).chart.nearest(xs, f)is the index of the point nearest a fraction, for hover.chart.pie(gpa, values, pad)makeschart.Slices (their angles),chart.sector(path, cx, cy, inner, outer, slice)the path of one,chart.sliceAt(slices, dx, dy, inner, outer)the slice at a point, andchart.polar(cx, cy, r, angle)a point on a circle.chart.stack(gpa, series, how)piles series up:series[s][i]is the i-th value of the s-th series, and the result's[s][i]achart.Segment(lo,hi) where it goes in the i-th stack.chart.Stackingis.standard(up from 0, negative values down),.normalized(in shares of each stack's sum) or.center(around 0, a streamgraph).
A live waveform
examples/chart-streaming draws three rolling series on one canvas, reducing each to the extremes of every pixel column before stroking, so 15 000 samples cost as much as the plot is wide:
fn draw(w: *Waveform, p: *ui.Painter) void {
    const r: ui.Rect = .{ .w = p.size.w, .h = p.size.h };
    for (0..6) |t| {
        const yy = chart.y(r, @as(f32, @floatFromInt(t)) / 5);
        p.line(0, yy, r.w, yy, 1, grid_color);
    }
    p.clipRect(r);
    for (0..3) |k| {
        var path = p.path();
        chart.line(&path, r, w.xs_of(k), w.ys_of(k), .linear);
        p.stroke(&path, .color(colors[k]), .{ .width = 2, .join = .round });
    }
}(xs_of and ys_of stand for the app's reduced fractions.) The labels of its axes are boxes placed with absolute and offset at the ticks of chart.Linear.init(0, 1).ticks(c.alloc(), 5). Since the data changes every frame, the view asks for the next with c.animationFrame().
Testing charts
Charts are boxes, text and a canvas, so the Tester sees them: their labels with t.hasText, the hover by moving the pointer over the plot (t.moveTo) and reading Result.hover, and their pixels with t.render. See src/ui/tests_chart.zig and Testing.